Setting up XHProf/XHGui profiling with Ansible
Once in a while I think about profiling my web applications to see if I can get them to run faster. There are cool tools out there like XHProf and XHGUI to help you do exactly that. And then I remember it took me quite some time to get it all set up... But now that I've started using Ansible I decided to document the set up process and share it with you. Today I will walk you through my Ansible role for setting up everything you need for profiling your first PHP script.
Recap
In the first post of this series I introduced you to Ansible. I showed you how to install Ansible, how to create a server inventory and how to execute some basic commands. In the second post I showed you you can easily organize your server configuration using roles and playbooks.
Today I will reuse the Vagrant box used in my previous posts so we don't have to install PHP and Apache anymore.
Check list
Let's start off by making a checklist of what we need:
- Install XHProf PECL extension
- Install XHGui
- Install xdebug PECL extension
- Set up a database for storing the profiling data
- Set up a webserver to show the profile reports
- Install Graphviz to visualize call graphs.
Role
I have created a role called profiling to bundle all the tasks, configuration and assets.
You can get the source from our GitHub repo.
Have a look at install_xhgui.yml to get an idea of the cool stuff Ansible can do.
Now run the playbook with:
ansible-playbook -i hosts profiling.yml --sudo -v
Profiling!
Now that everything is installed you can point your browser to http://10.0.0.10/profiling.php?_profile=1 and you'll see Hello World! (again).
Below that there are hyperlinks to the XHGui frontend which looks like this:
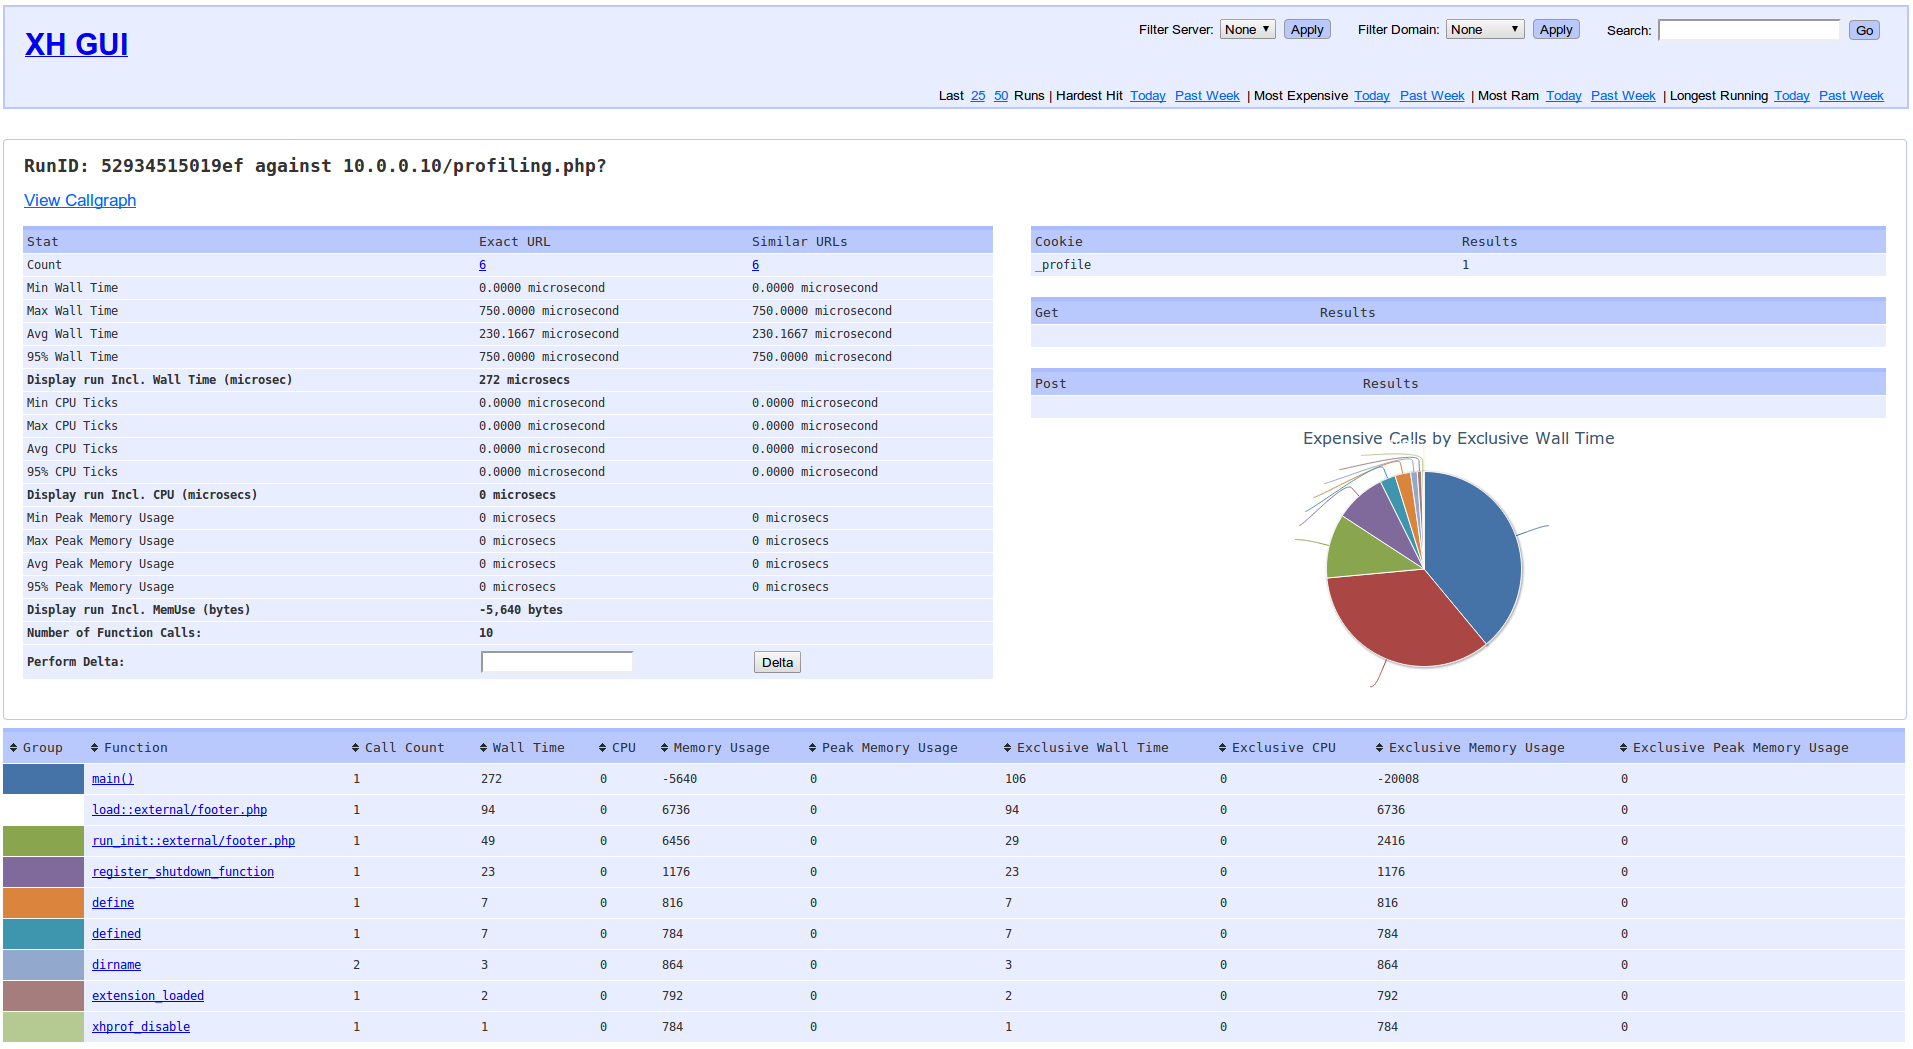
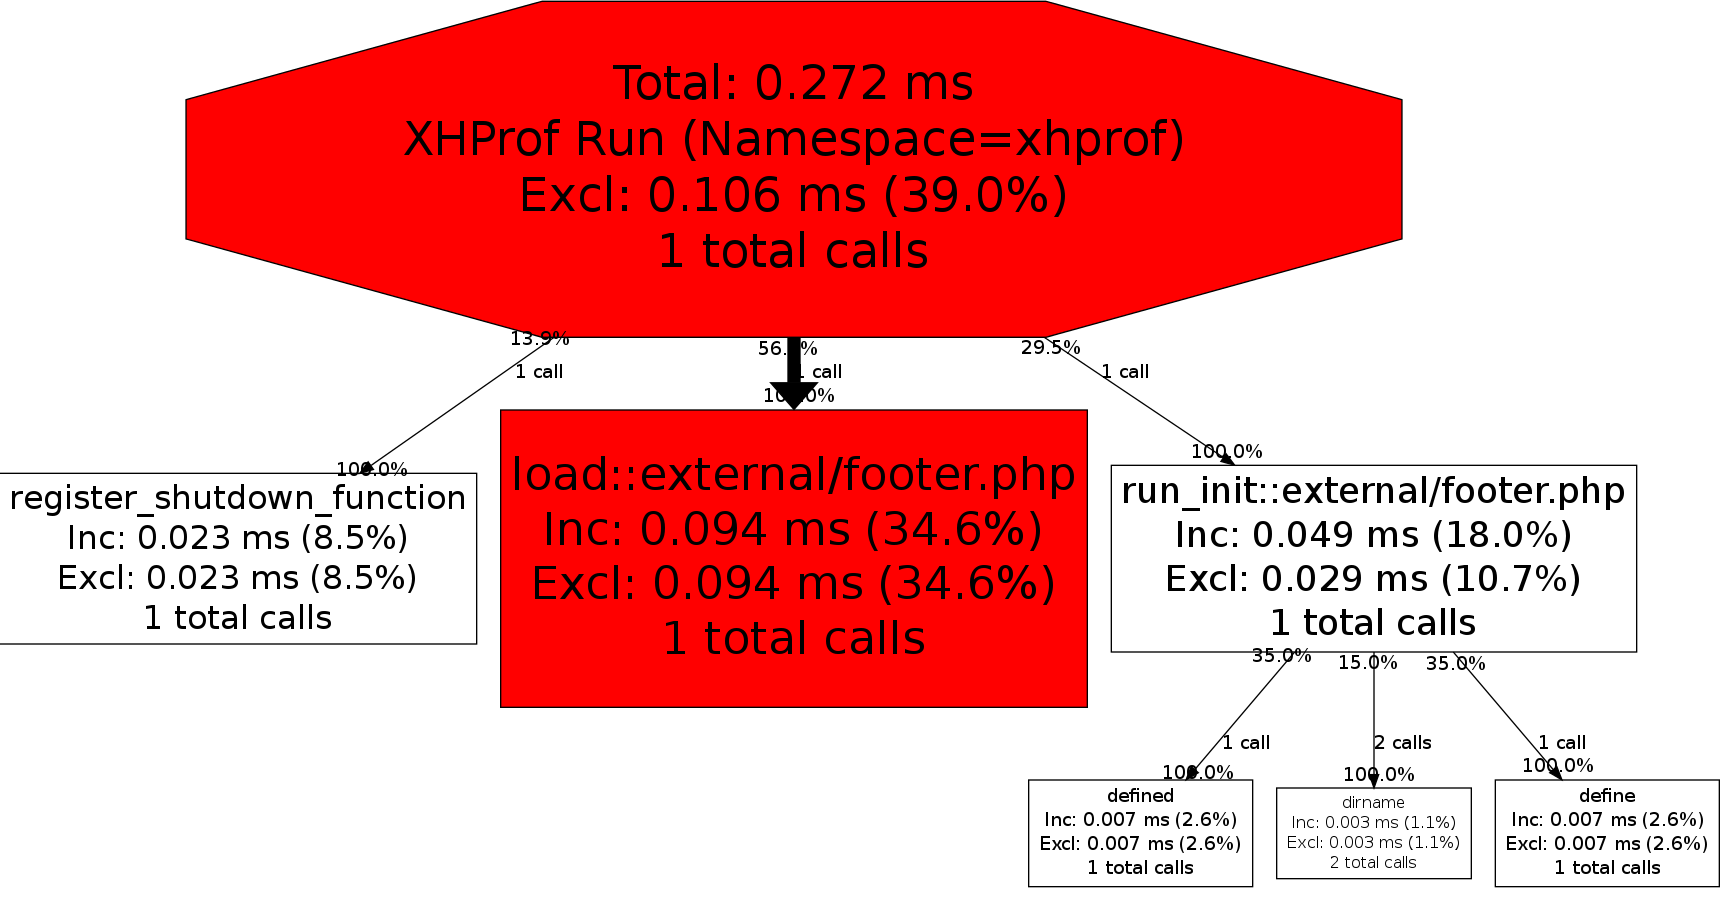
When you click on "View Call" you'll see your program's execution path. (Which does not look very impressive now but can grow very big when you have a real application).
Conclusion
Ansible makes setting up profiling a piece of cake. Now you can focus on profiling instead of getting it all up and running.
Acknowledgements
Thanks to @lornajane for showing how to generate a callgraph!
Check these other great articles that I used for this post:
- Profiling a PHP Application
- The Need for Speed: Profiling PHP with XHProf and XHGui
- Profiling with XHGui